Subscription growth hack (by PayKickstart)
Facebook Group - 3,932 members
Visit Group
If you’re new to the SaaS game, figuring out which metrics and reports to pay attention to can be overwhelming.
It’s easy to focus on metrics that don’t matter much, like what screen resolution your customers are using, simply because they’re there.
Once you figure out the important metrics, you gain a much deeper understanding of how successful your business is. You also gain a sense of how effective your marketing is. And how much money you make per customer per year.
We’ve put together this guide to help you pay attention to the metrics that actually matter.
Customer churn, or churn, is how many customers you lose during a certain period of time. This metric provides a better understanding of customer retention based on activity across that time period, over a month or quarter, for instance.
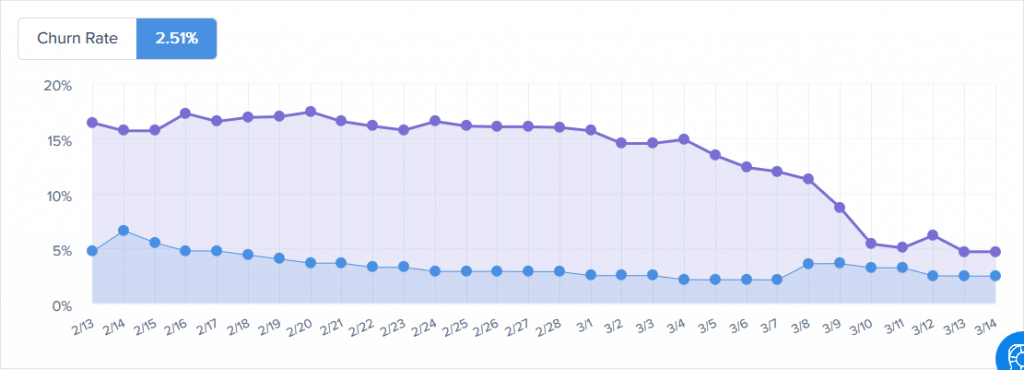
Your churn rate lets you know what percentage of your customers aren’t getting what they wanted out of your service. As a result, you get a sense of what that something is. This could be things like not having the features that your customers were hoping for when they signed up. Or perhaps people weren’t using your service as much as they expected and felt it wasn’t worth the price.
It could also mean that you’re not targeting the right people in the first place. If you notice a high churn rate during a specific period of time, look at where those customers were coming to you from. If they’re all coming from the same source (or similar sources), you may need to work on your targeting.
Customer Lifetime Value, sometimes also just called Lifetime Value or LTV, is how much money you make per customer during their engagement with your platform.
This gives you an accurate sense of growth and helps you make informed decisions about customer acquisition. It also provides you with a sense of how long it takes for a customer to payback the cost of acquiring them. The shorter the period of time, the better.
To calculate customer lifetime value:
Your customer acquisition cost (CAC) is how much it costs to acquire a single customer. This is calculated by adding up all the sales and marketing costs for a given period, and dividing those costs by how many new customers were picked up during that same period.
CAC lets you know how long it takes for a customer to pay for themselves. This lets you determine if you’re pursuing a segment of customers that has the value you need to grow as a company or not.
Ideally, CAC should be paid back within 12 months. As much as possible, you want to keep CAC lower in the early stages. Even if you have the funding in place, you don’t want to spend too much per customer, unless those customers are high ticket customers.
Because of the nature of how SaaS pricing is structured, it’s often measured by how much comes in every month, or year. This form of revenue, known as recurring revenue, is typically measured in two different ways: monthly and annually.
Recurring revenue are worth tracking for a few reasons. If you have investors, it gives them both a short-term peak at how their investment is doing (MRR) and a long-term view (ARR). It’s also helpful when trying to plan out marketing efforts and tracking growth.
Monthly Recurring Revenue (MRR)
Monthly recurring revenue is how much money is coming in every month from subscriptions purchased by users.
MMR is a short-term view of how well your company is doing. It shows how much money is coming in from your customers every month and provides a sense of the health of your company.
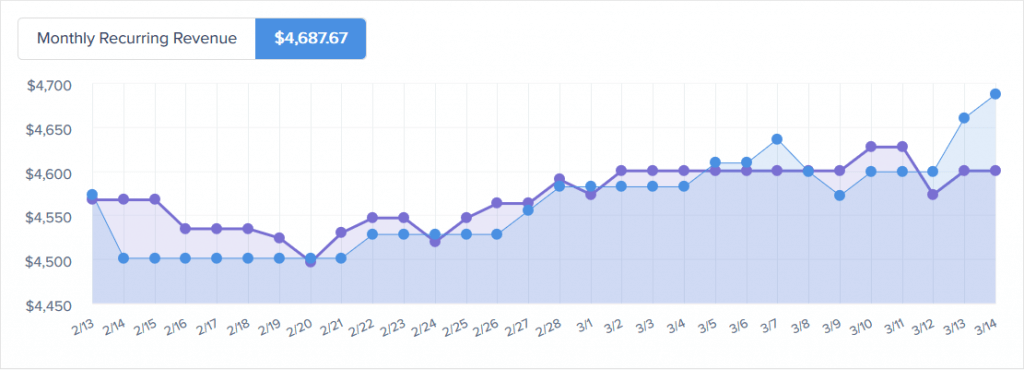
When calculating MRR, take into consideration all recurring aspects of your service. This means factoring things like, subscription cost, upgrades or any add-ons that users might get. Downgrades also need to be included. These aren’t customers that have been lost, but they affect MRR by reducing the amount of money coming in.
Annual recurring revenue (ARR)
Annual recurring revenue is how much money is coming in from subscriptions on an annual basis. This is calculated by multiplying your MRR by 12.
ARR is a long-term look at the success of your company. It provides an understanding of how much money will be coming in every year, based on the number of users you have signed up.
Customer Retention Rate is the opposite of churn. This is how many customers you’re able to keep during a specific period of time.
This metric is key for a subscription-based service because you want your customers to be repeat customers. If they’re not, chances are you need to either fine-tune your product or change your marketing efforts to target people who are going to love your software.
To calculate your customer retention rate, look at the number of active users who continued their subscriptions. Then, compare those to the number of active users at the beginning of the time period. That period of time can be monthly, quarterly, or annually, depending on how you like to do your reporting.
As an example, say you have 1,200 users at the beginning of the month. At the end of the month, 950 keep their subscriptions. Your calculations will look like this: 950 / 1200 = 0.79166. Multiply 0.79166 by 100 to get the percentage. In this case there’s a Customer Retention Rate of 79.1%.
One of the great things about metrics is that once you figure out which ones you want to track (like the ones that are listed above), you start to notice patterns.
The longer you watch them, the more obvious the patterns become.
These patterns provide an invaluable look into how your business is doing, whether or not you’re attracting the right kinds of customers, and where there are areas of potential growth. That’s what makes metrics such a beautiful thing to SaaS companies. They are hard data that allow you to make actionable decisions based on the patterns that you’re seeing.
What’s your favorite SaaS metric to track? Leave a comment and tell us why you like it so much.
Mark Thompson is CEO of PayKickstart and a serial entrepreneur. He is passionate about helping thousands of entrepreneurs and businesses grow through advice, automating payments and providing affiliate tools.
Read More About Mark Thompson
Talk to a knowledgeable product specialist to learn more about your requirements and ensure PayKickstart is the perfect fit for your needs.
